

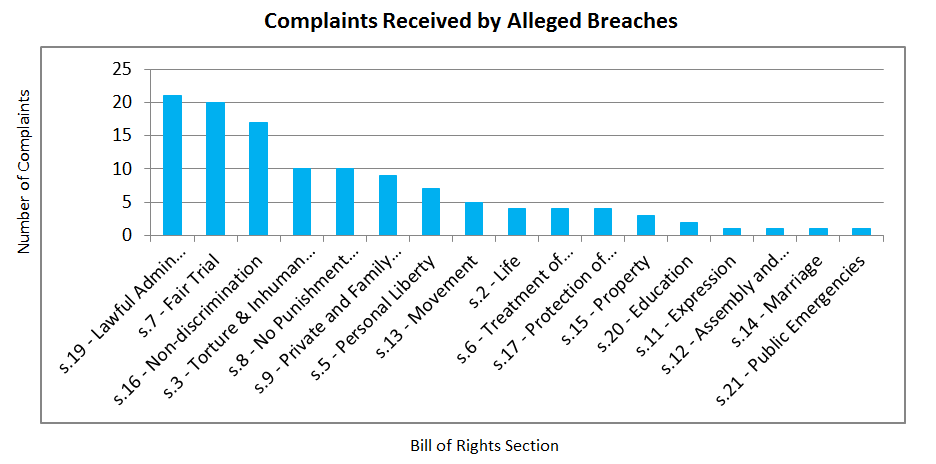
The chart and graph below illustrate the complaints received categorised by sections of the Bill of Rights where breaches are alleged by complainants to have taken place. Note that s.1 – Guarantee of Rights, Freedoms and Responsibilities has not been included as any possible breach would automatically engage this section. The chart and graph below only represent the views of complainants regarding which of their rights may have been breached; it does not represent actual breaches (NB: complainants may allege breaches of multiple rights).
|
Bill of Rights Section |
Total | Percentage |
|---|---|---|
| Lawful Administrative Action (s.19) | 21 | 18% |
| Fair Trial (s.7) | 20 | 17% |
| Non-discrimination (s.16) | 12 | 14% |
| Torture & Inhuman Treatment (s.3) | 10 | 8% |
| No Punishment without Law (s.8) | 10 | 8% |
| Private and Family Life (s.9) | 9 | 8% |
| Personal Liberty (s.5) | 7 | 6% |
| Movement (s.13) | 5 | 4% |
| Life (s.2) | 4 | 3% |
| Treatment of Prisoners (s.6) | 4 | 3% |
| Protection of Children (s.17) | 4 | 3% |
| Property (s.15) | 3 | 3% |
| Education (s.20) | 2 | 2% |
| Expression (s.11) | 1 | 1% |
| Assembly and Association (s.12) | 1 | 1% |
| Marriage (s.14) | 1 | 1% |
| Public Emergencies (s.21) | 1 | 1% |
| TOTAL | 120 | 100% |
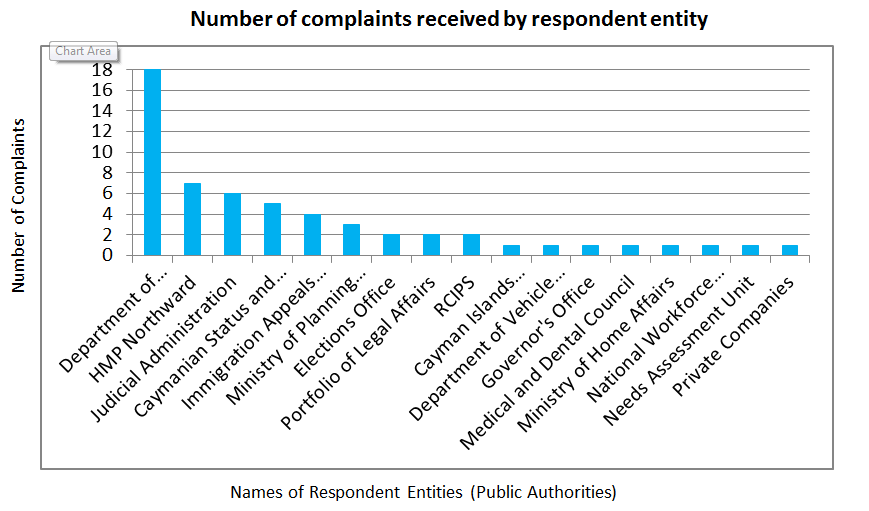
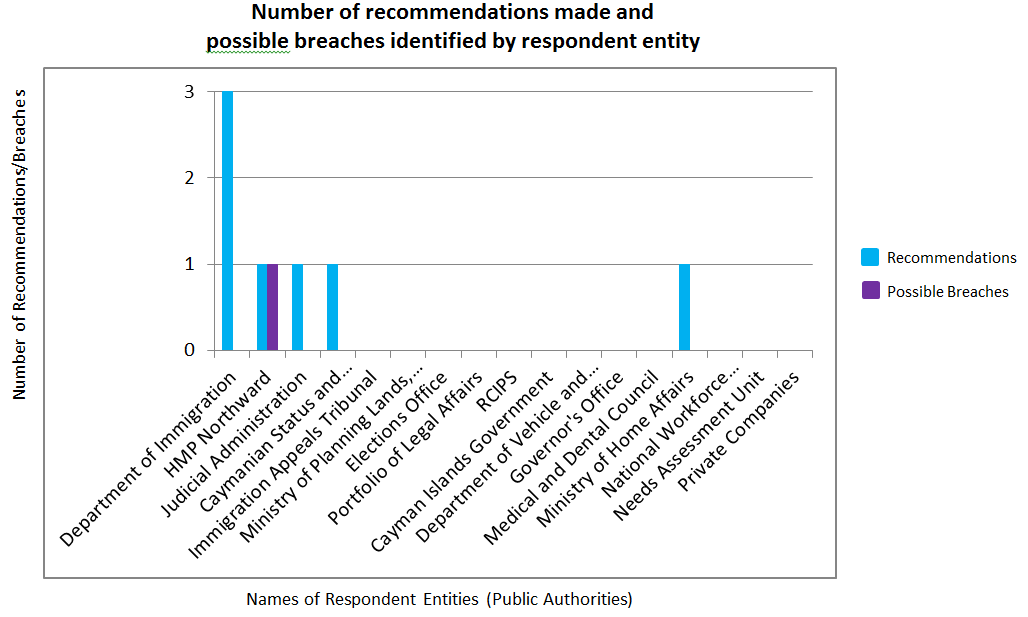
The chart and graphs below illustrate the public authorities against which formal complaints have been made to the Commission in 2016. They also summarise instances where possible breaches have been deemed to have taken place by the Commission, within the context of a specific complaint, based on the evidence presented. In some cases investigations into possible breaches are still ongoing.
| # | Public Entity* | Received | Recommendations | Possible Breach |
|---|---|---|---|---|
| 1 | Department of Immigration | 18 | 3 | |
| 2 | HMP Northward | 7 | 1 | 1 |
| 3 | Judicial Administration | 6 | 1 | |
| 4 | Caymanian Status and Permanent Residency Board | 5 | 1 | |
| 5 | Immigration Appeals Tribunal | 4 | ||
| 6 | Ministry of Planning, Lands, Agriculture, Housing and Infrastructure | 3 | ||
| 7 | Elections Office | 2 | ||
| 8 | Portfolio of Legal Affairs | 2 | ||
| 9 | RCIPS | 2 | ||
| 10 | Cayman Islands Government | 1 | ||
| 11 | Department of Vehicle and Drivers' Licensing | 1 | ||
| 12 | Governor's Office | 1 | ||
| 13 | Medical and Dental Office | 1 | ||
| 14 | Ministry of Home Affairs | 1 | 1 | |
| 15 | National Workforce Development Agency | 1 | ||
| 16 | Needs Assessment Unit | 1 | ||
| 17 | Private Companies | 1 | ||
| TOTAL | 57 | 7 | 1 |
*Whilst the Commission does not accept complaints on incidents that have taken place over one year prior to the complaint being filed, except in cases on ongoing breaches, complaints reflected in this section may have been filed against public officials who may or may not still be in office at the time the complaint is filed.
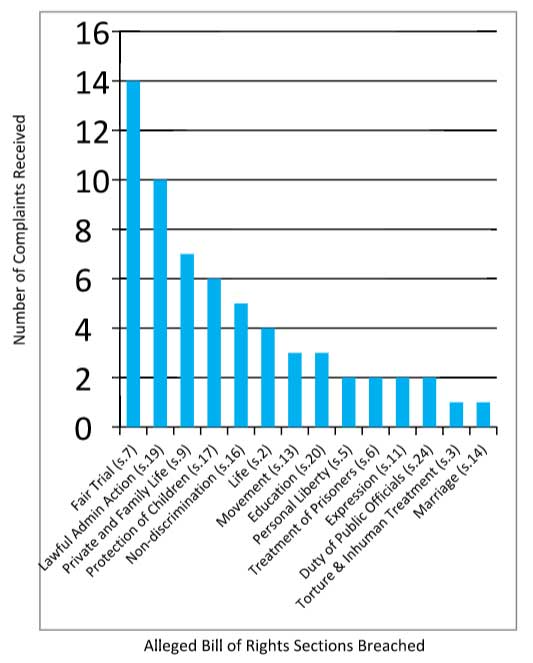
The chart and graph below illustrate the complaints received categorised by sections of the Bill of Rights where breaches are alleged by complainants to have taken place. Note that s.1 – Guarantee of Rights, Freedoms and Responsibilities has not been included as any possible breach would automatically engage this section. The chart and graph below only represent the views of complainants on which rights may have been breached in their particular situation; they do not represent actual breaches (NB: complainants may allege breaches of multiple rights).
| Bill of Rights Section | Total | Percentage |
|---|---|---|
| s.7 – Fair Trial | 14 | 19% |
| s.19 – Lawful Admin Action | 10 | 13% |
| s.9 – Private and Family Life | 7 | 9% |
| s.17 – Protection of Children | 6 | 8% |
| s.16 – Non-discrimination | 5 | 7% |
| s.2 – Life | 4 | 5% |
| s.13 – Movement | 3 | 4% |
| s.20 – Education | 3 | 4% |
| s.5 – Personal Liberty | 2 | 3% |
| s.6 – Treatment of Prisoners | 2 | 3% |
| s.11 – Expression | 2 | 3% |
| s.24 – Duty of Public Officials | 2 | 3% |
| s.3 – Torture & Inhuman Treatment | 1 | 1% |
| s.14 – Marriage | 1 | 1% |
| Total | 62 |
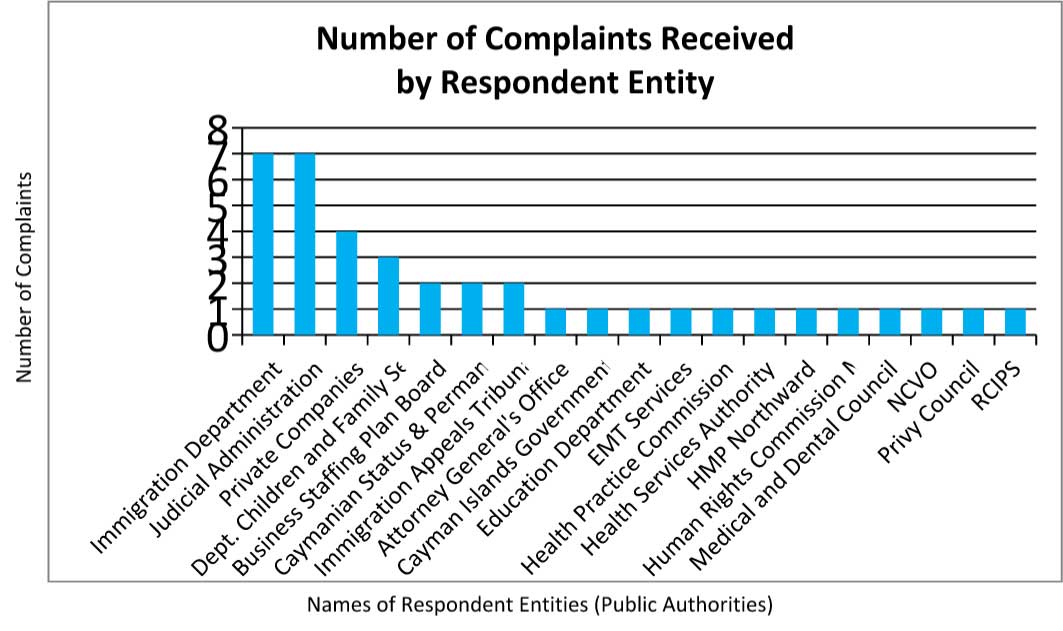
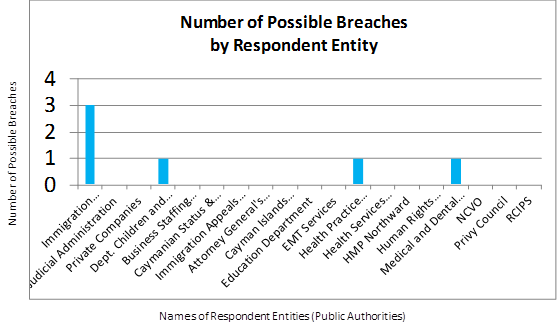
The chart and graphs below illustrate the public authorities against which formal complaints have been made to the Human Rights Commission in the 2015 year. They also summarise instances where possible breaches have been deemed to have taken place by the Commission, within the context of a specific complaint, based on the evidence presented. In some cases investigations into possible breaches are still ongoing.
| # | Public Entity | Received | Possible Breach |
|---|---|---|---|
| 1 | Immigration Department | 7 | 3 |
| 2 | Judicial Administration | 7 | |
| 3 | Private Companies | 4 | |
| 4 | Dept. Children and Family Services | 3 | 1 |
| 5 | Business Staffing Plan Board | 2 | |
| 6 | Caymanian Status & Permanent Residency Board | 2 | |
| 7 | Immigration Appeals Tribunal | 2 | |
| 8 | Attorney General's Office | 1 | |
| 9 | Cayman Islands Government | 1 | |
| 10 | Education Department | 1 | |
| 11 | EMT Services | 1 | |
| 12 | Health Practice Commission | 1 | 1 |
| 13 | Health Services Authority | 1 | |
| 14 | HMP Northward | 1 | |
| 15 | Human Rights Commission Member | 1 | |
| 16 | Medical and Dental Council | 1 | 1 |
| 17 | NCVO | 1 | |
| 18 | Privy Council | 1 | |
| 19 | RCIPS | 1 | |
| TOTAL | 39 | 6 |
N.B.: In maintaining the confidentiality of the complainants, detailed information pertaining to complaints is not published by the Human Rights Commission.
During the 2014 reporting year, the HRC received eighteen complaints from members of the public alleging breaches by public officials of their human rights. Of those cases, three remained open at the end of the reporting year. The HRC also acknowledged a breach existed with regard to one of those complaints and has written the relevant authorities to discuss remedies. There were also two cases which remained open from the previous reporting year.
During the 2013 reporting year, the HRC received twenty-six (26) complaints from members of the public alleging breaches by public officials of their human rights. Of those cases eight (8) remained open at the end of the reporting year.
During the 2012 reporting year, the Commission received twenty-three (23) complaints from members of the public alleging breaches by public officials of their human rights. Of those cases four (4) remained open at the end of the reporting year.
During the 2011 reporting period the HRC received eleven (11) formal complaints from the public. The Commission did not find evidence sufficient to substantiate a violation of human rights in any of the complaints examined. In the process of examining each complaint, the Commission was guided by its established policies and procedures manual.
During the 2010 reporting period the HRC received twenty-six (26) formal complaints from the public.